Power BI – FAQs

Are the excel/Power BI files available to download?

Yes the source Excel/CSV files and a completed Power BI report file are available to download from the first module (available for free) of my Financial Reporting with Power BI e-learning course available at www.powerplatformfinance.com. Note that this content aligns to what is covered on the GrowCFO course, and there will be significant overlap in the material, but I will make the e-learning course a supplementary benefit for those GrowCFO course attendees who attend all workshop sessions, rather than making it a pre-requisite or alternative form of learning.
 
How the GrowCFO Power BI course compare to “Dashboard in a day” by Microsoft which I’ve done before?
 
It’s great that you’ve done Dashboard in a day! – It’s a good introduction to get your first experience of Power BI (with a focus on basic visualisation) but it’s nowhere near either the level of detail or breadth of topics that is in the Grow CFO courses. In the courses we cover everything from combining CSV files in Power Query into a single dataset (removing header rows), using exchange rates to calculate reporting currency amounts, Time-intelligence such as MTD/QTD/YTD views and DAX measures to calculate financial ratios. The courses are specifically aimed at finance professionals as they use an accounting dataset and are shaped around common requirements from stakeholders (e.g. those who consume and explore month-end reports); the Dashboard in a Day is by nature a generic course with a focus on how to use some of the core features of Power BI.
 

Are there safety controls like ‘check sums’ to validate that the data is correctly calculating from the source files?

No, there are no built-in check sums unfortunately! This is something you could conceivably build in yourself but I think you would need to also have another independent extract of the data to check against. For example, if you were building a report based on a SQL database, you could create two connections to that database in Power BI (or create one of the connections in Excel for example), with the one used as a check just returning the total raw row count/aggregations of the rows.

What best practices or approaches do you recommend for optimizing sales forecasting and production planning using Power BI, including integrating external data sources?

Whilst there are basic formulas (e.g. linear regression) and visual level forecasting capabilities in Power BI, it is not a planning or forecasting tool by default (it is for reporting/analytics). However, it can be extended for such scenarios using add-ons such as Acterys and Inforiver. There are also libraries in R/Python which are well suited for forecasting and can be brought into Power BI through either through using a Python script as a (local) data source, creating Python visuals in Power BI desktop or leveraging notebooks/data science models in Microsoft Fabric if this is able to be leveraged as a strategic source for the Power BI reports. Integrating internal and external data can be done just using Power BI to a large extent, but with large volumes or complex access mechanisms (e.g. APIs) it may be preferable to use a data platform such as Fabric or Azure to extract and process this data before bringing it into Power BI.

How long did it take to get this data together in the source files and then set the relationships in Power BI?

On the fundamentals course, the first three modules (each a 2 hour workshop) are designing the required data structure based on stakeholder requirements, building the data model using the Power Query component and creating table relationships/measures in DAX. Therefore in a structured environment we are able to complete this within 5-6 hours, though it may take less or more time on your data depending on its complexity/cleanliness and your current levels of skill and experience with Power BI.

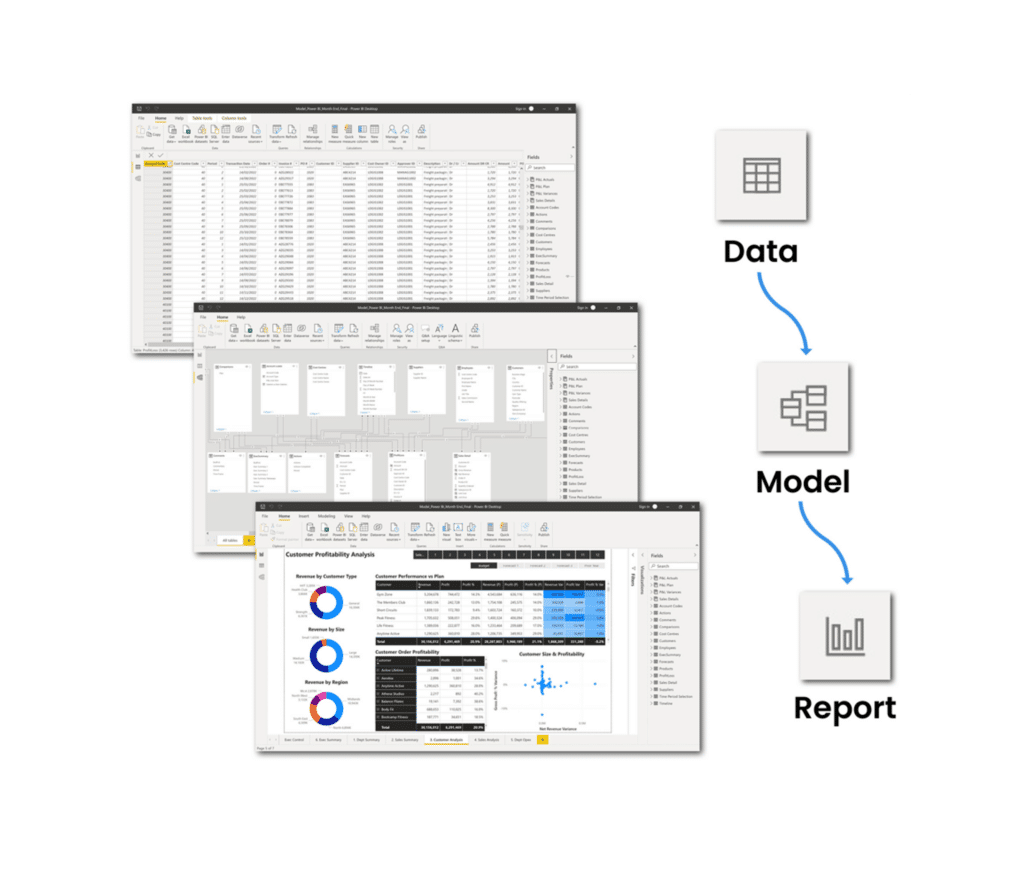
Watch Rishi Sapra take you through Power BI during this webinar replay:
 

Related Articles

Responses

Your email address will not be published. Required fields are marked *